

Tracking team performance
Seeing how your decisions make an impact makes the job 2.91 times more fun. Gather engineering metrics, backlog health signals, and focus distribution on one canvas and be ready to take action before surprises land.
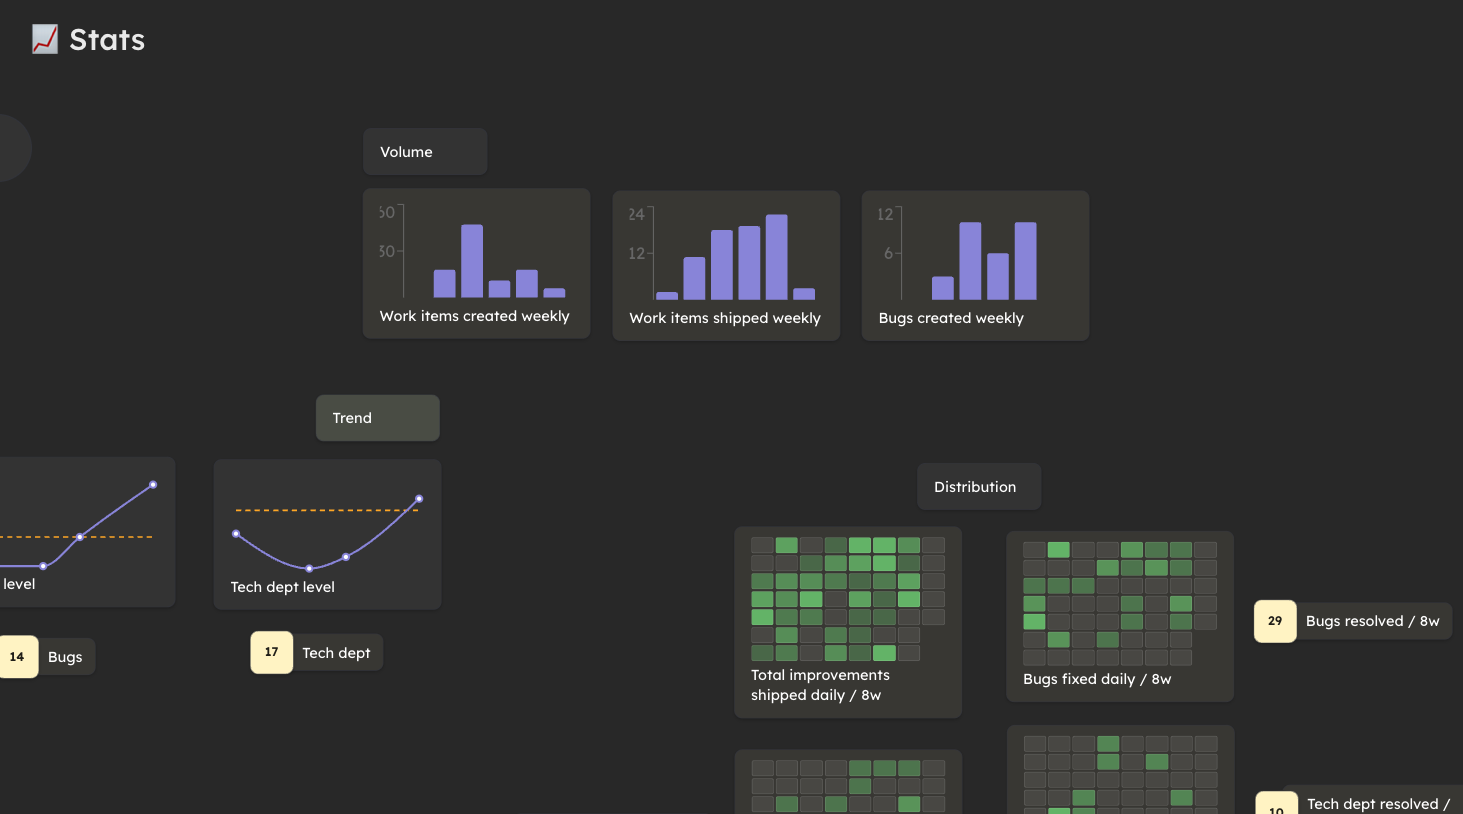
What you will see
The template combines metric entries, backlog indicators, and chart references arranged for an engineering lead review.
You define which numbers matter — cycle time, defect trends, capacity.